
Introducing valencia-now: real-time traffic information about Valencia
valencia-now, a project that I announced a few days ago with great reception on X, is now public as of today 🎉.
This simple dashboard allows visualization of real-time, historical, and aggregated data on traffic and air quality in Valencia.
Real-time information
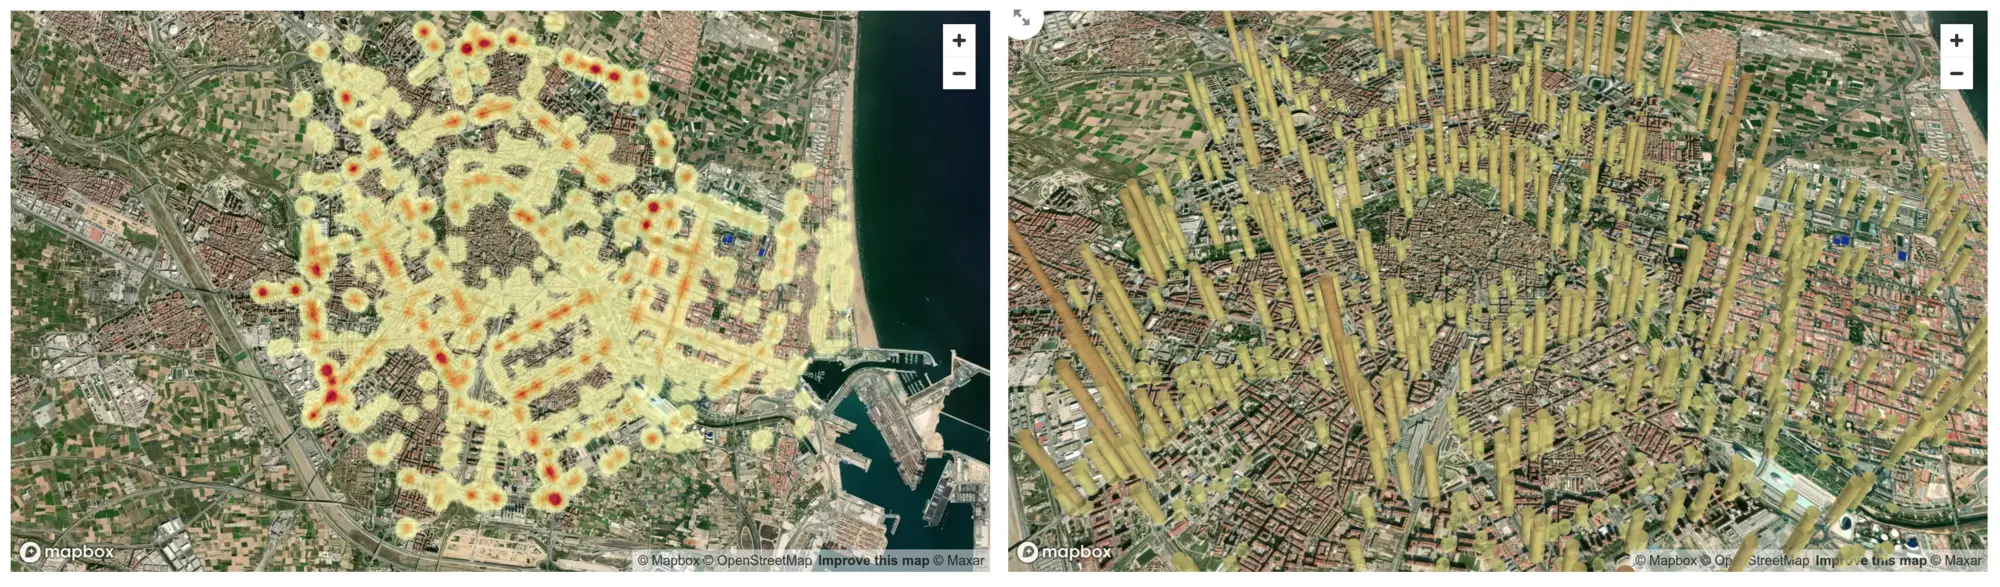
The open data portal of the Spanish city of Valencia provides
real-time traffic data for both cars (and other motor vehicles) and
bicycles. A series of electromagnetic loops distributed throughout the
city are capable of measuring the intensity of vehicles passing through
them. This information is published on an hourly basis for motor
vehicles and approximately every 30 minutes for bicycles. With that
information, valencia-now is able to build these two maps representing
current traffic intensity:
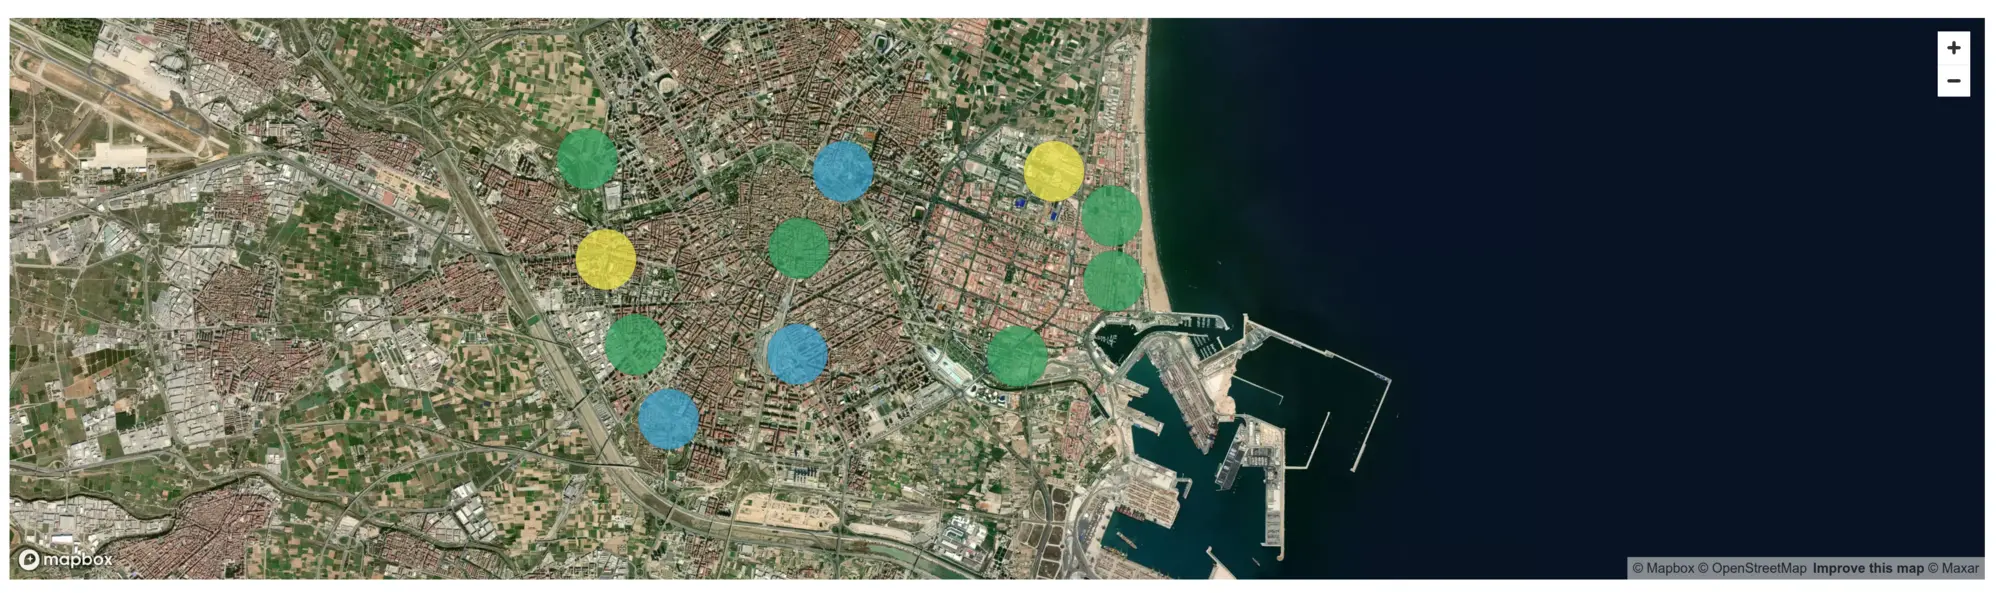
The bicycle traffic is also represented in the same way, as well as
the air quality data obtained from various measurement stations
located in different parts of the city. In this case, we are
representing the air quality index, a value that can range from 1
(hazardous) in color purple to 6 (good) in color blue.
Historical and aggregated data
If I were to stop at that point, I wouldn't be adding much additional value to this data, since the open data portal itself already provides some simple visualizations of the current state of traffic and air quality.
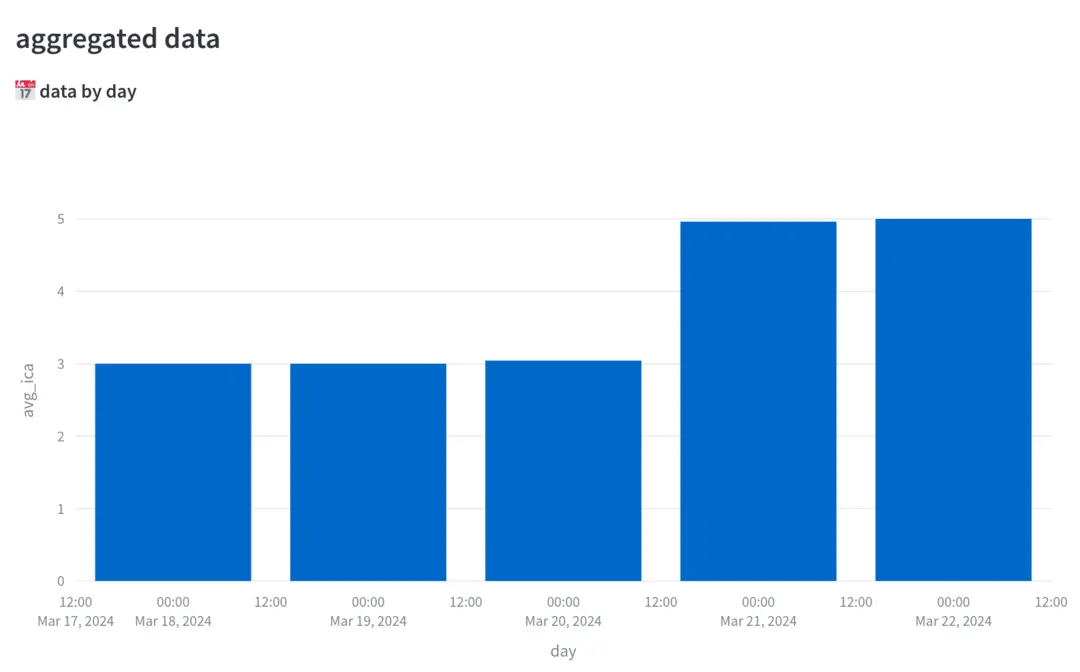
However, valencia-now is also collecting and storing this information which allows me not only to see the current status but also the evolution.
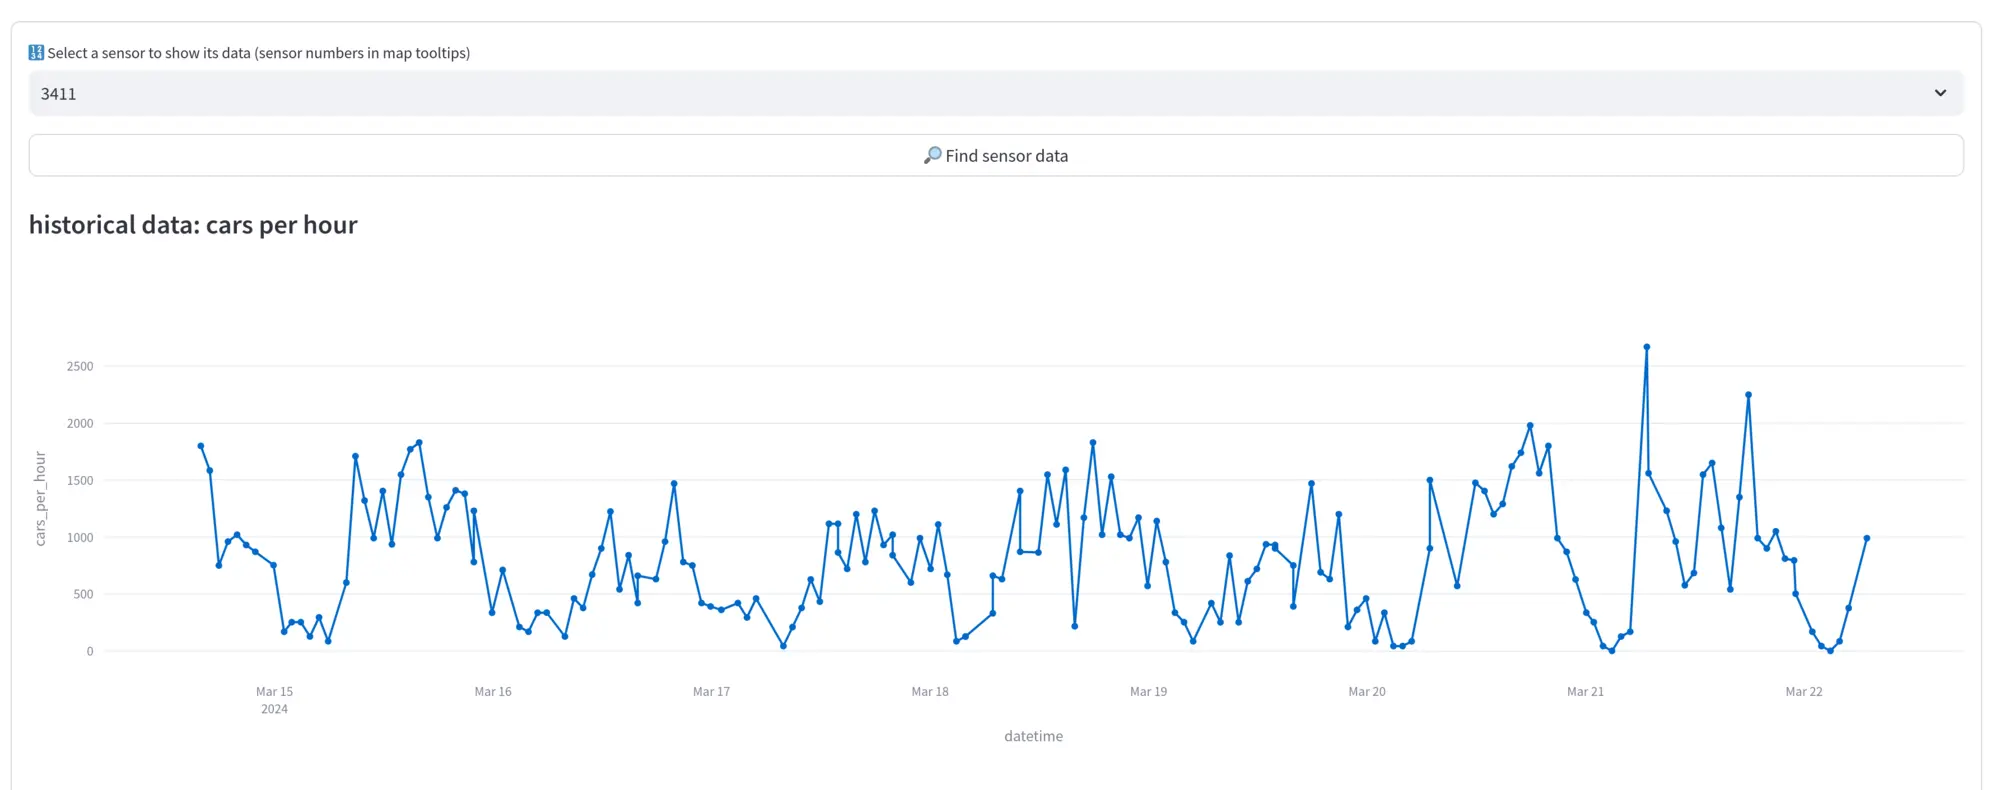
With that historical data, I am also able to provide aggregations such as the following one that shows how the air quality in the city centre improved just a day after the Fallas finished.
Next steps
In the following days, I would like to create some additional
blogposts. I want to explain technical details about the data
ingestion and the data transformation processes (spoiler, tinybird
made this extremly simple) and also about public open data
iniciatives.
At some point in time I would like to make the collected data available for everyone, but this will require some work.
🗨️ As always, feel free to contact me (unmonoqueteclea@gmail.com) for
whatever doubt, suggestion or idea you may have. Happy to receive your
feedback!